Klimakarten
Data Visualization design for constructive journalism
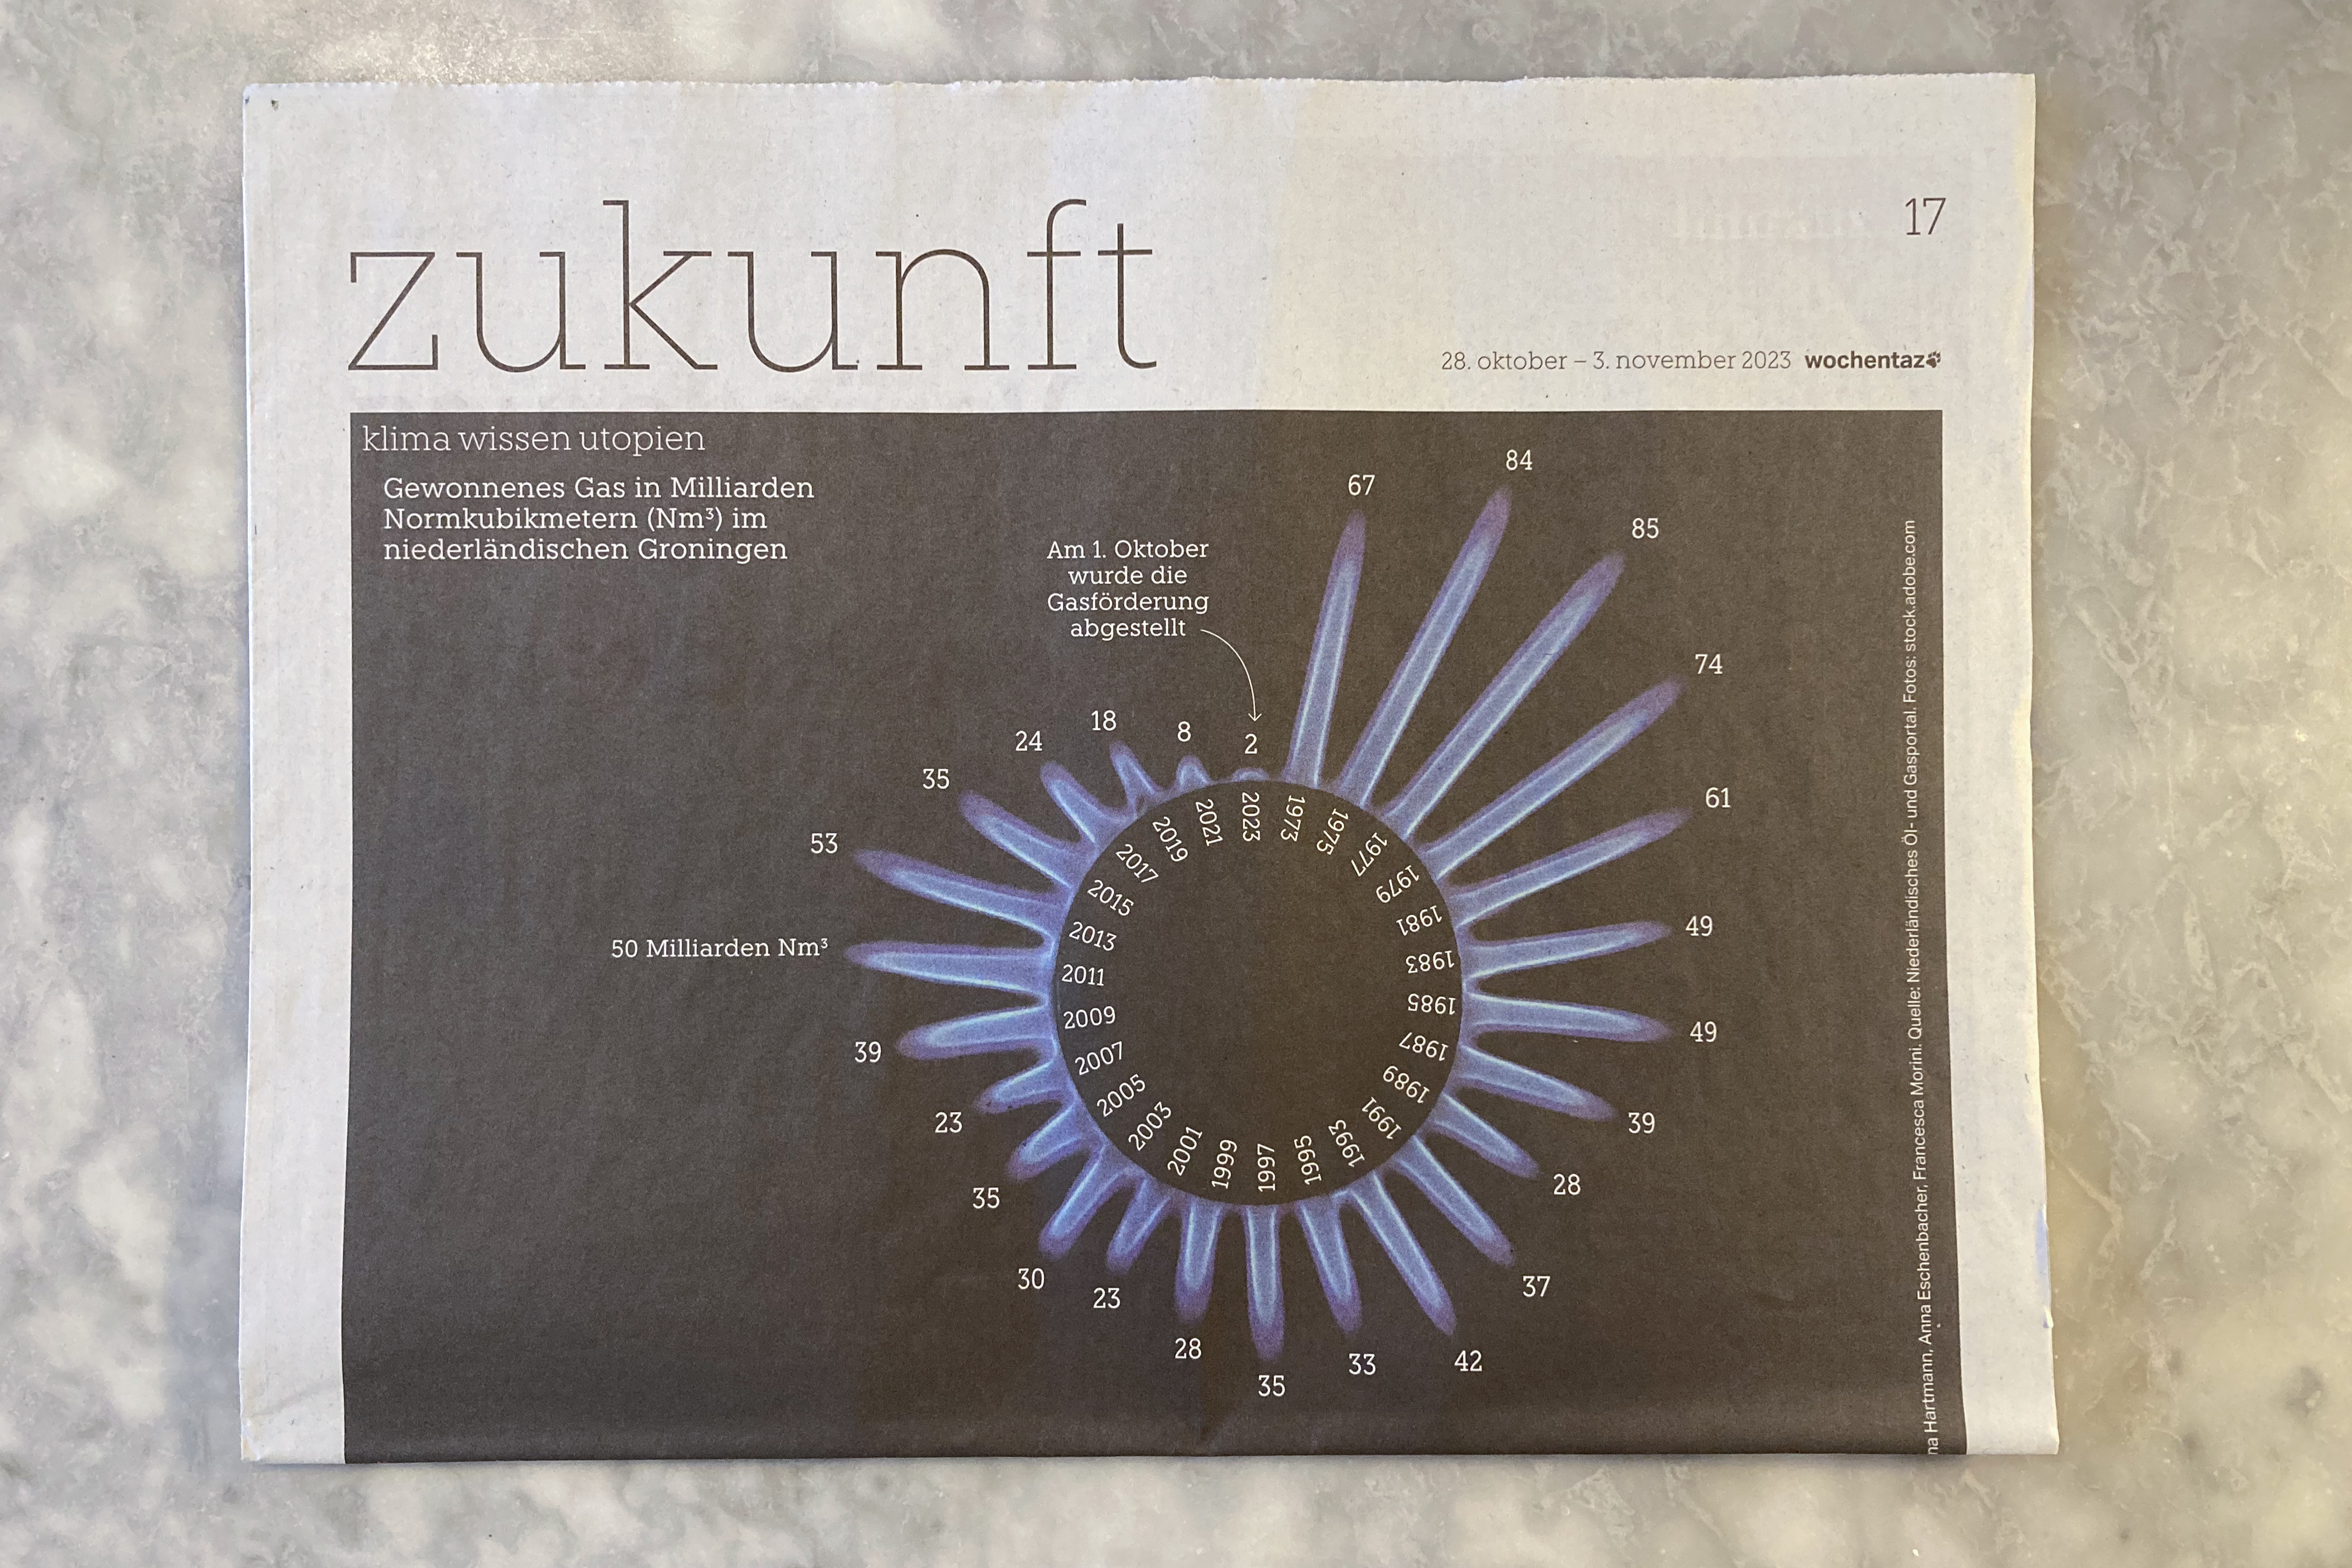
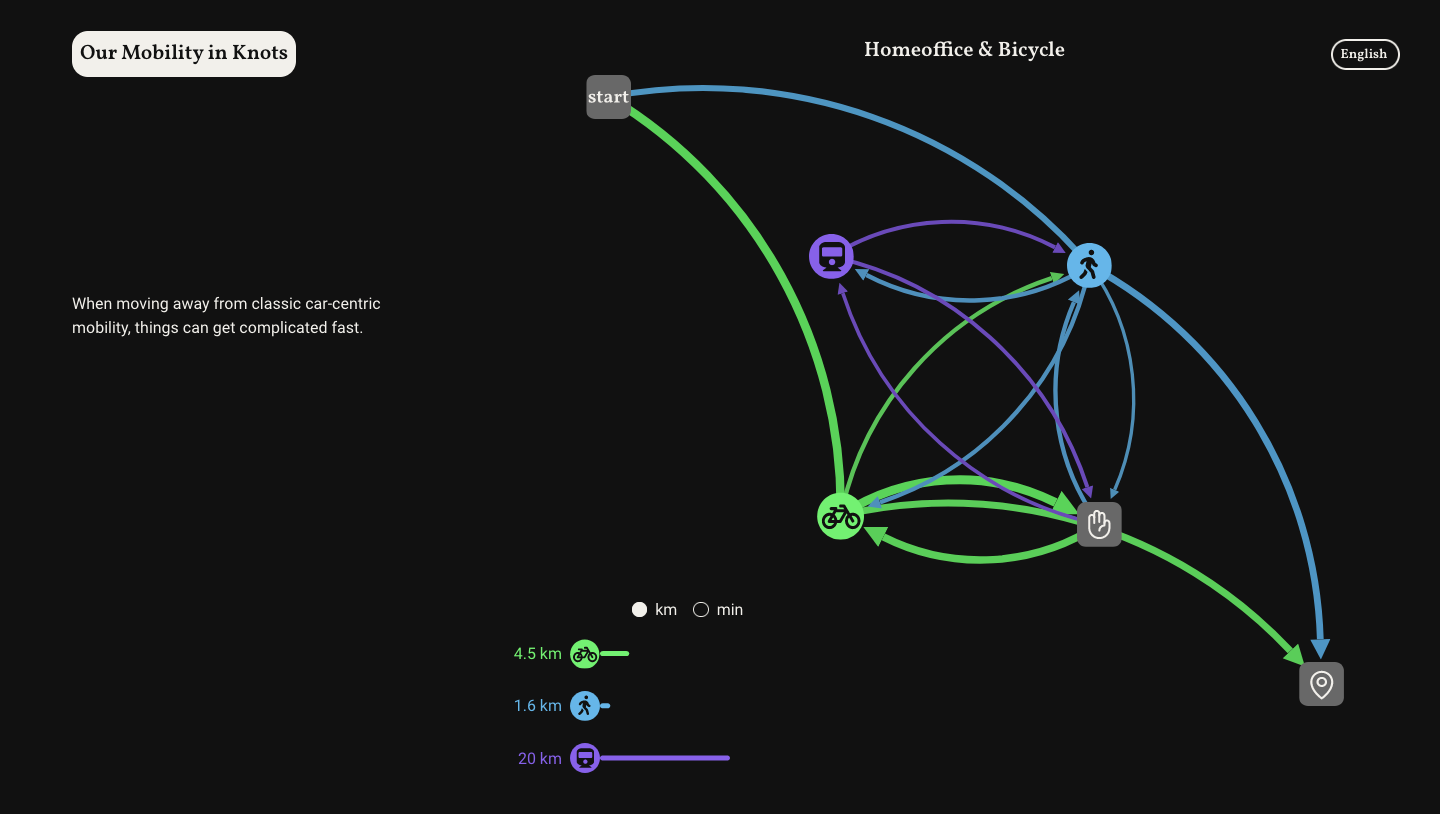
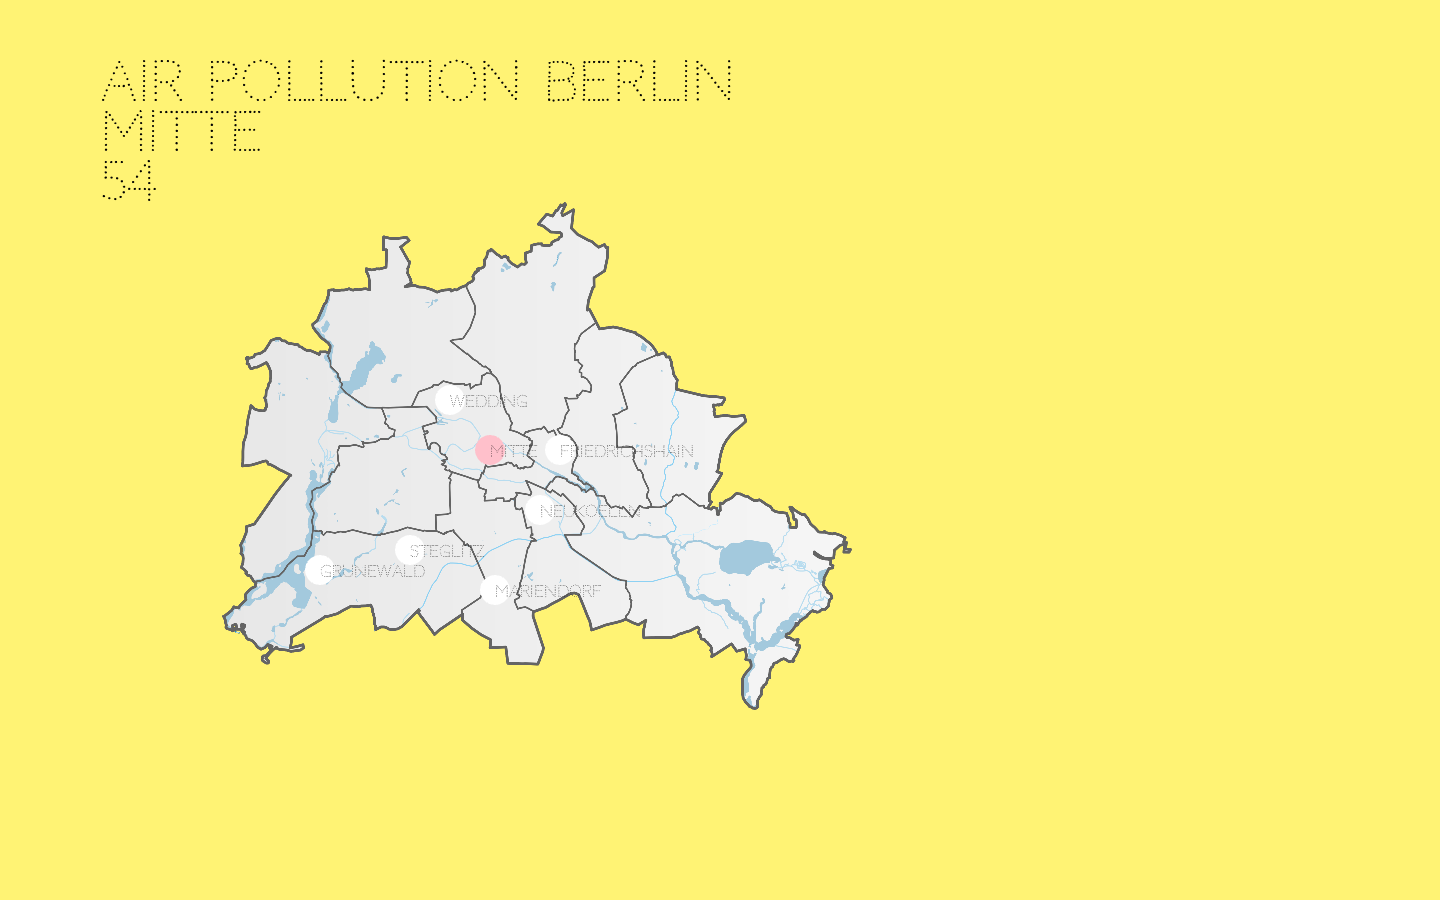
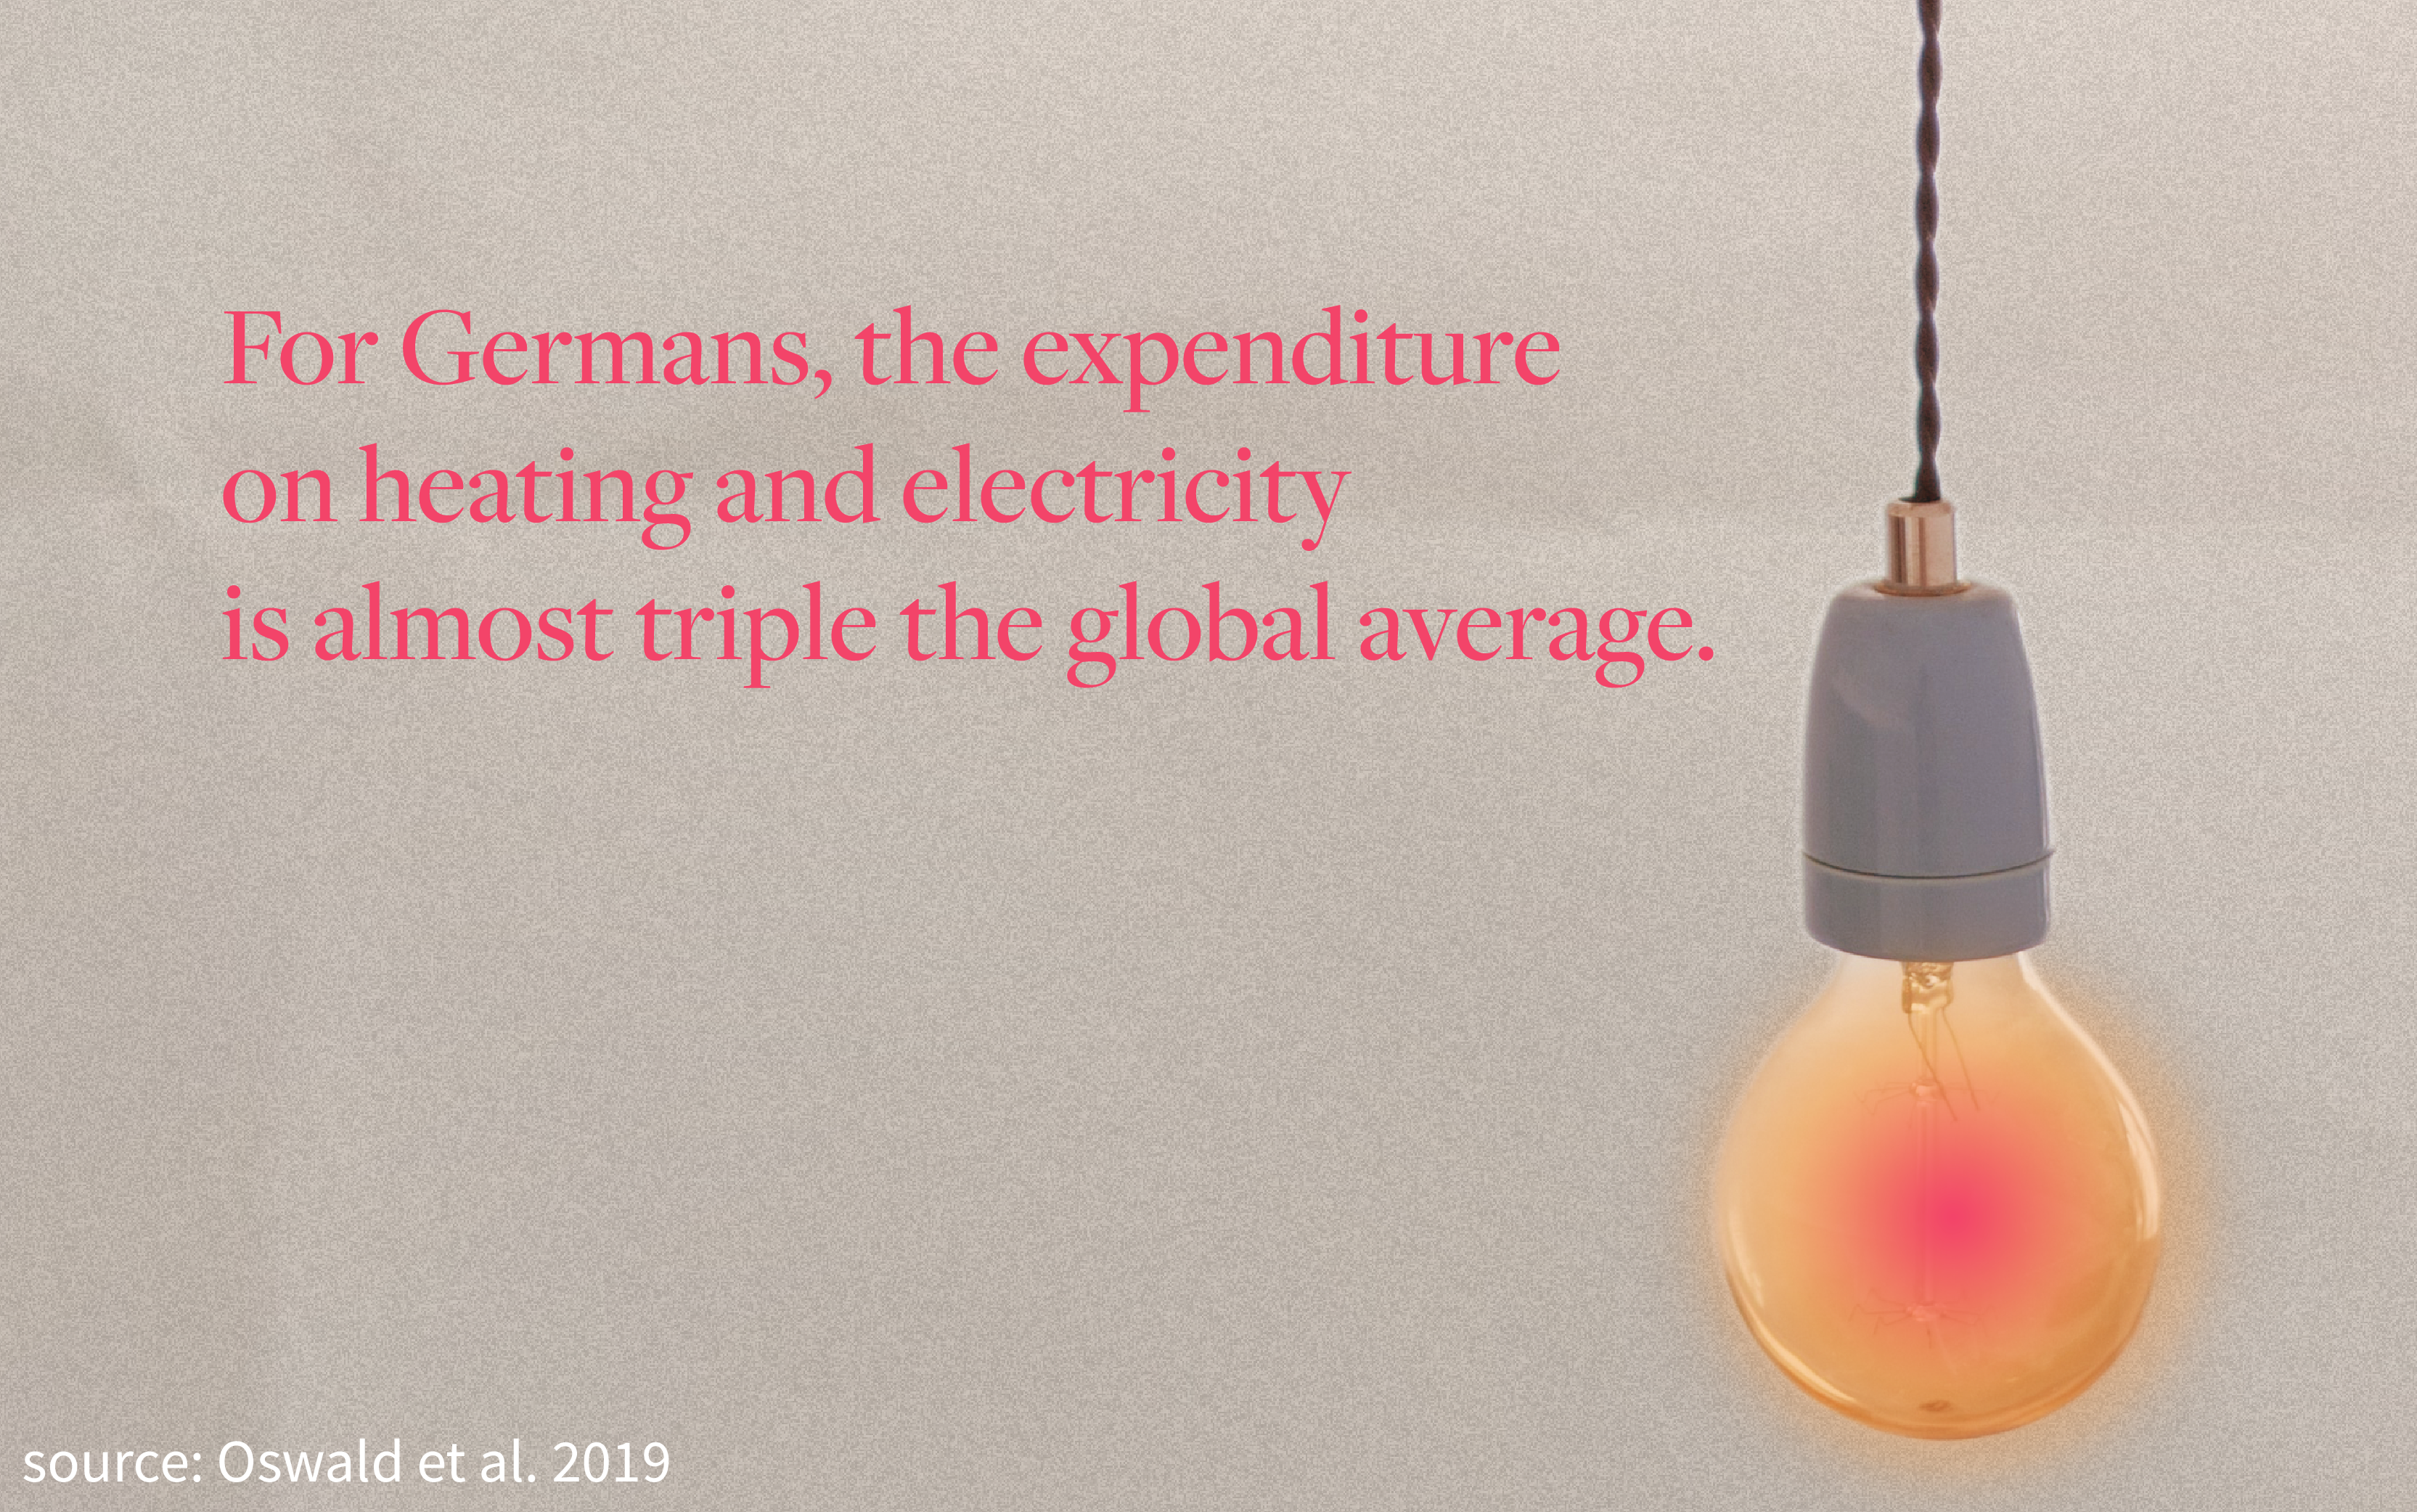
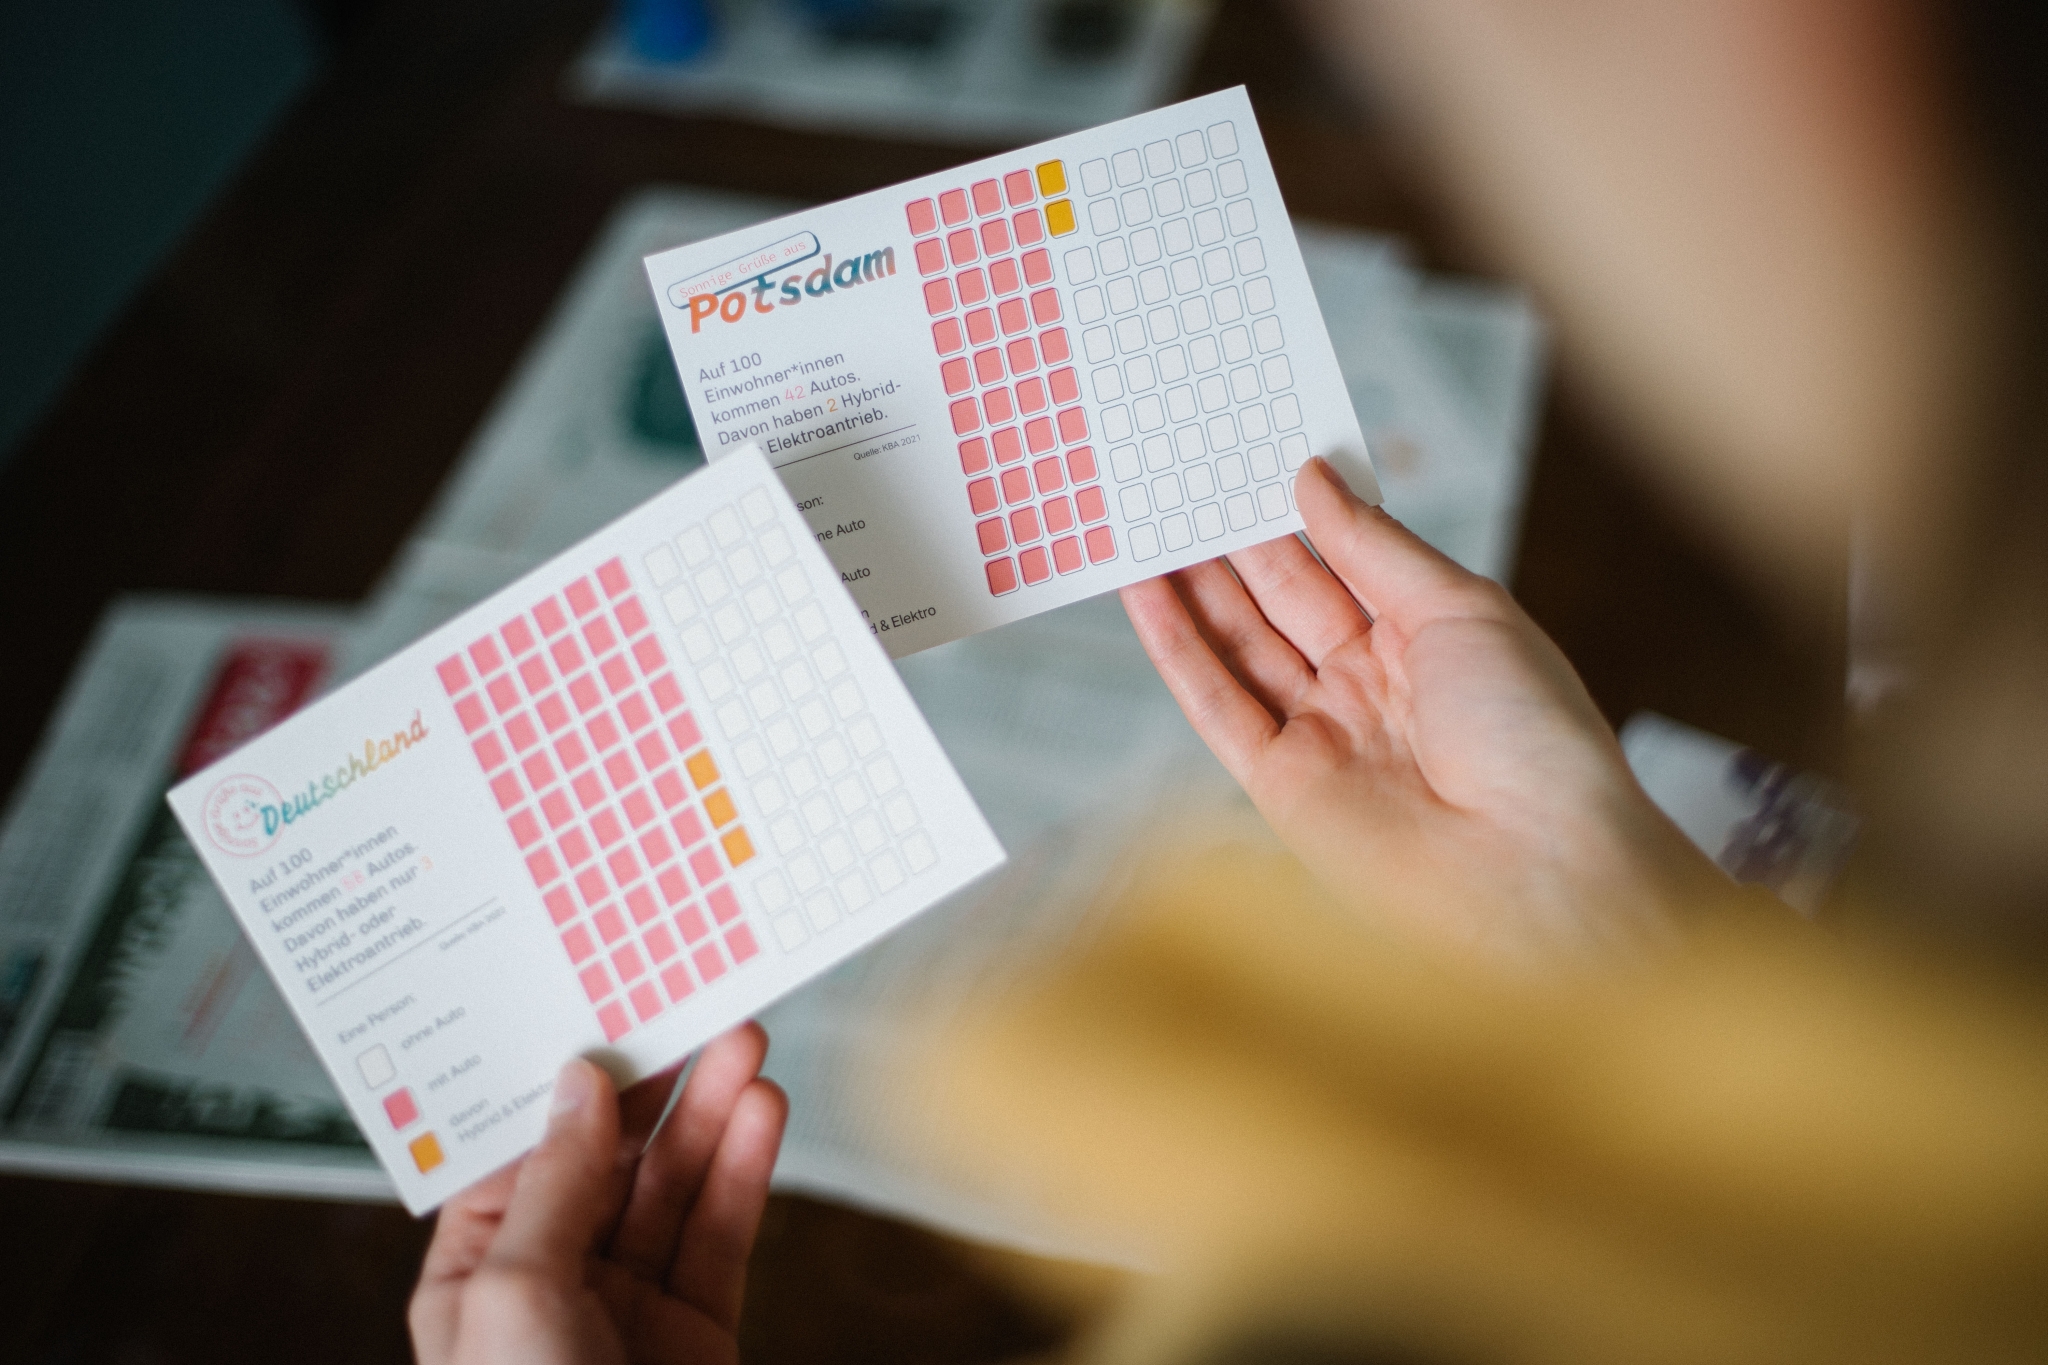
In this research project, the UCLAB (FH Potsdam) collaborated with the newspaper taz to design data visualizations for newspaper readers. We designed, developed and produced digital and analog postcards, which communicate climate protection data on a local level for Germany. The research about this paper was published in an IEEE paper.
This work was a collaboration with Francesca Morini, Anna Eschenbacher, Marian Dörk and the taz journalists Luise Strothmann, Lalon Sander, Jean-Philipp Baeck, Jelene Malkowski.
We implemented the application with python for data preprocessing, and Js, React, and D3 for the web application. The code is open source and can be found on github.
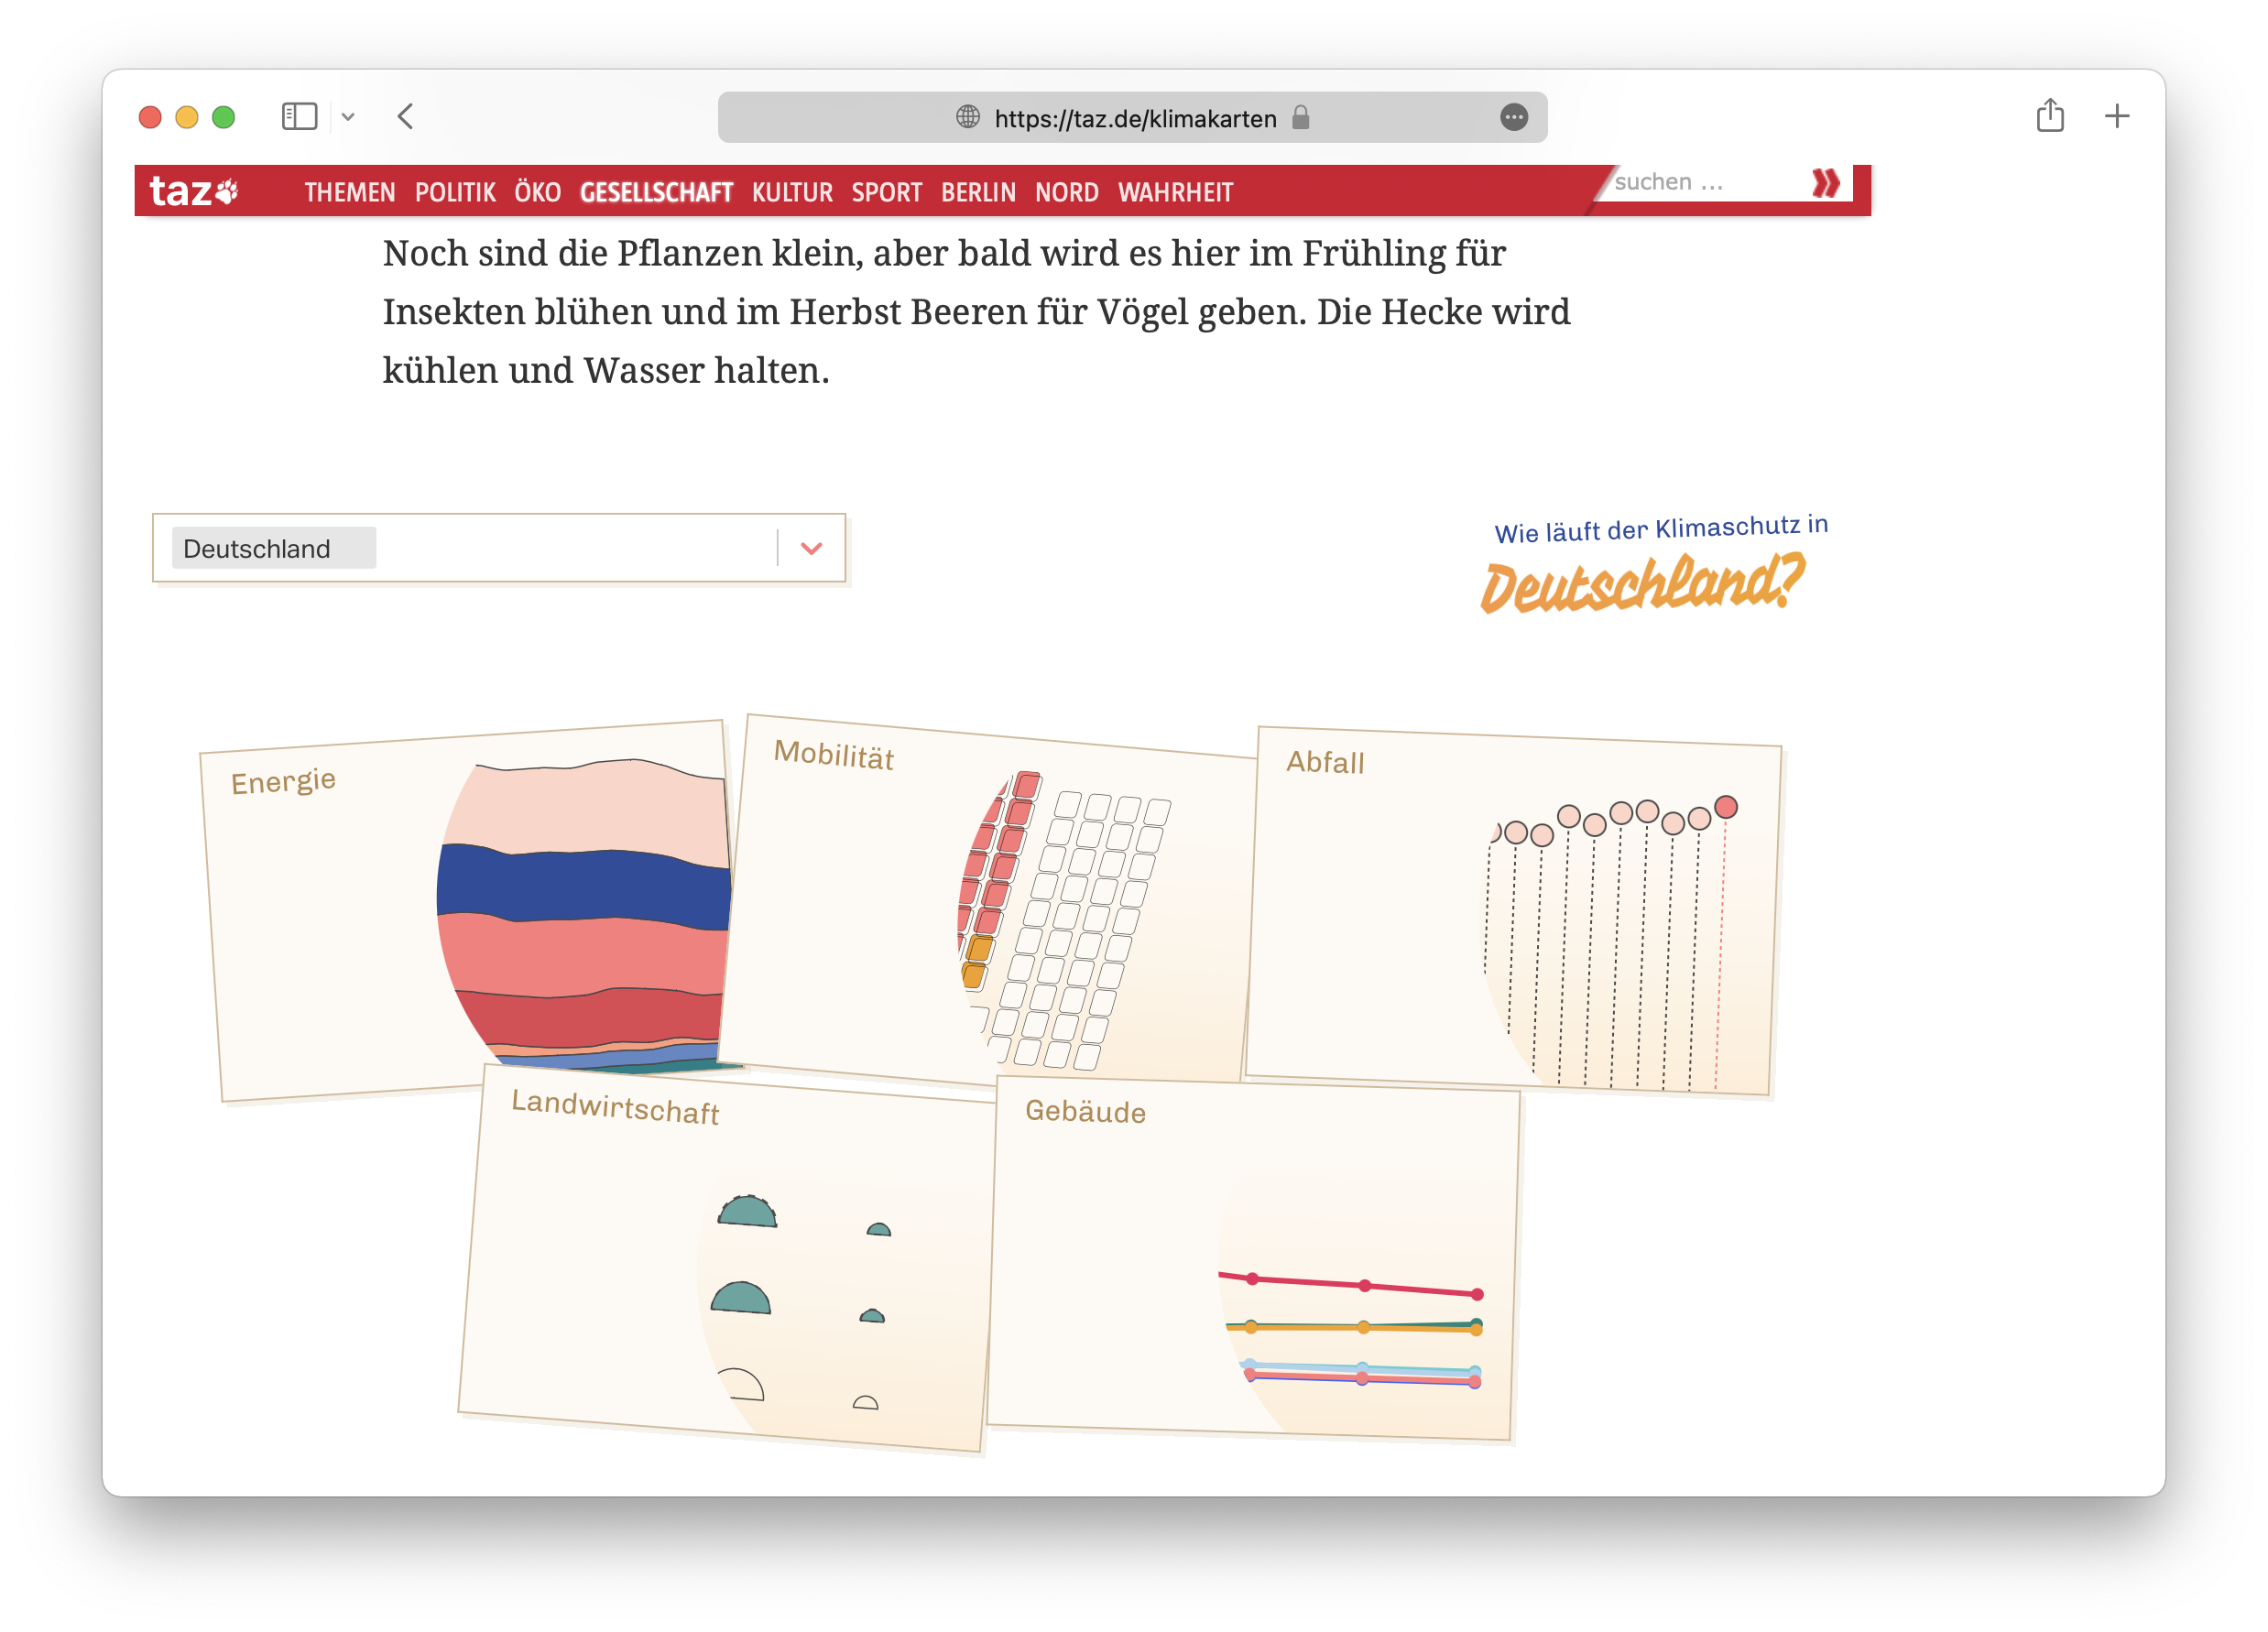
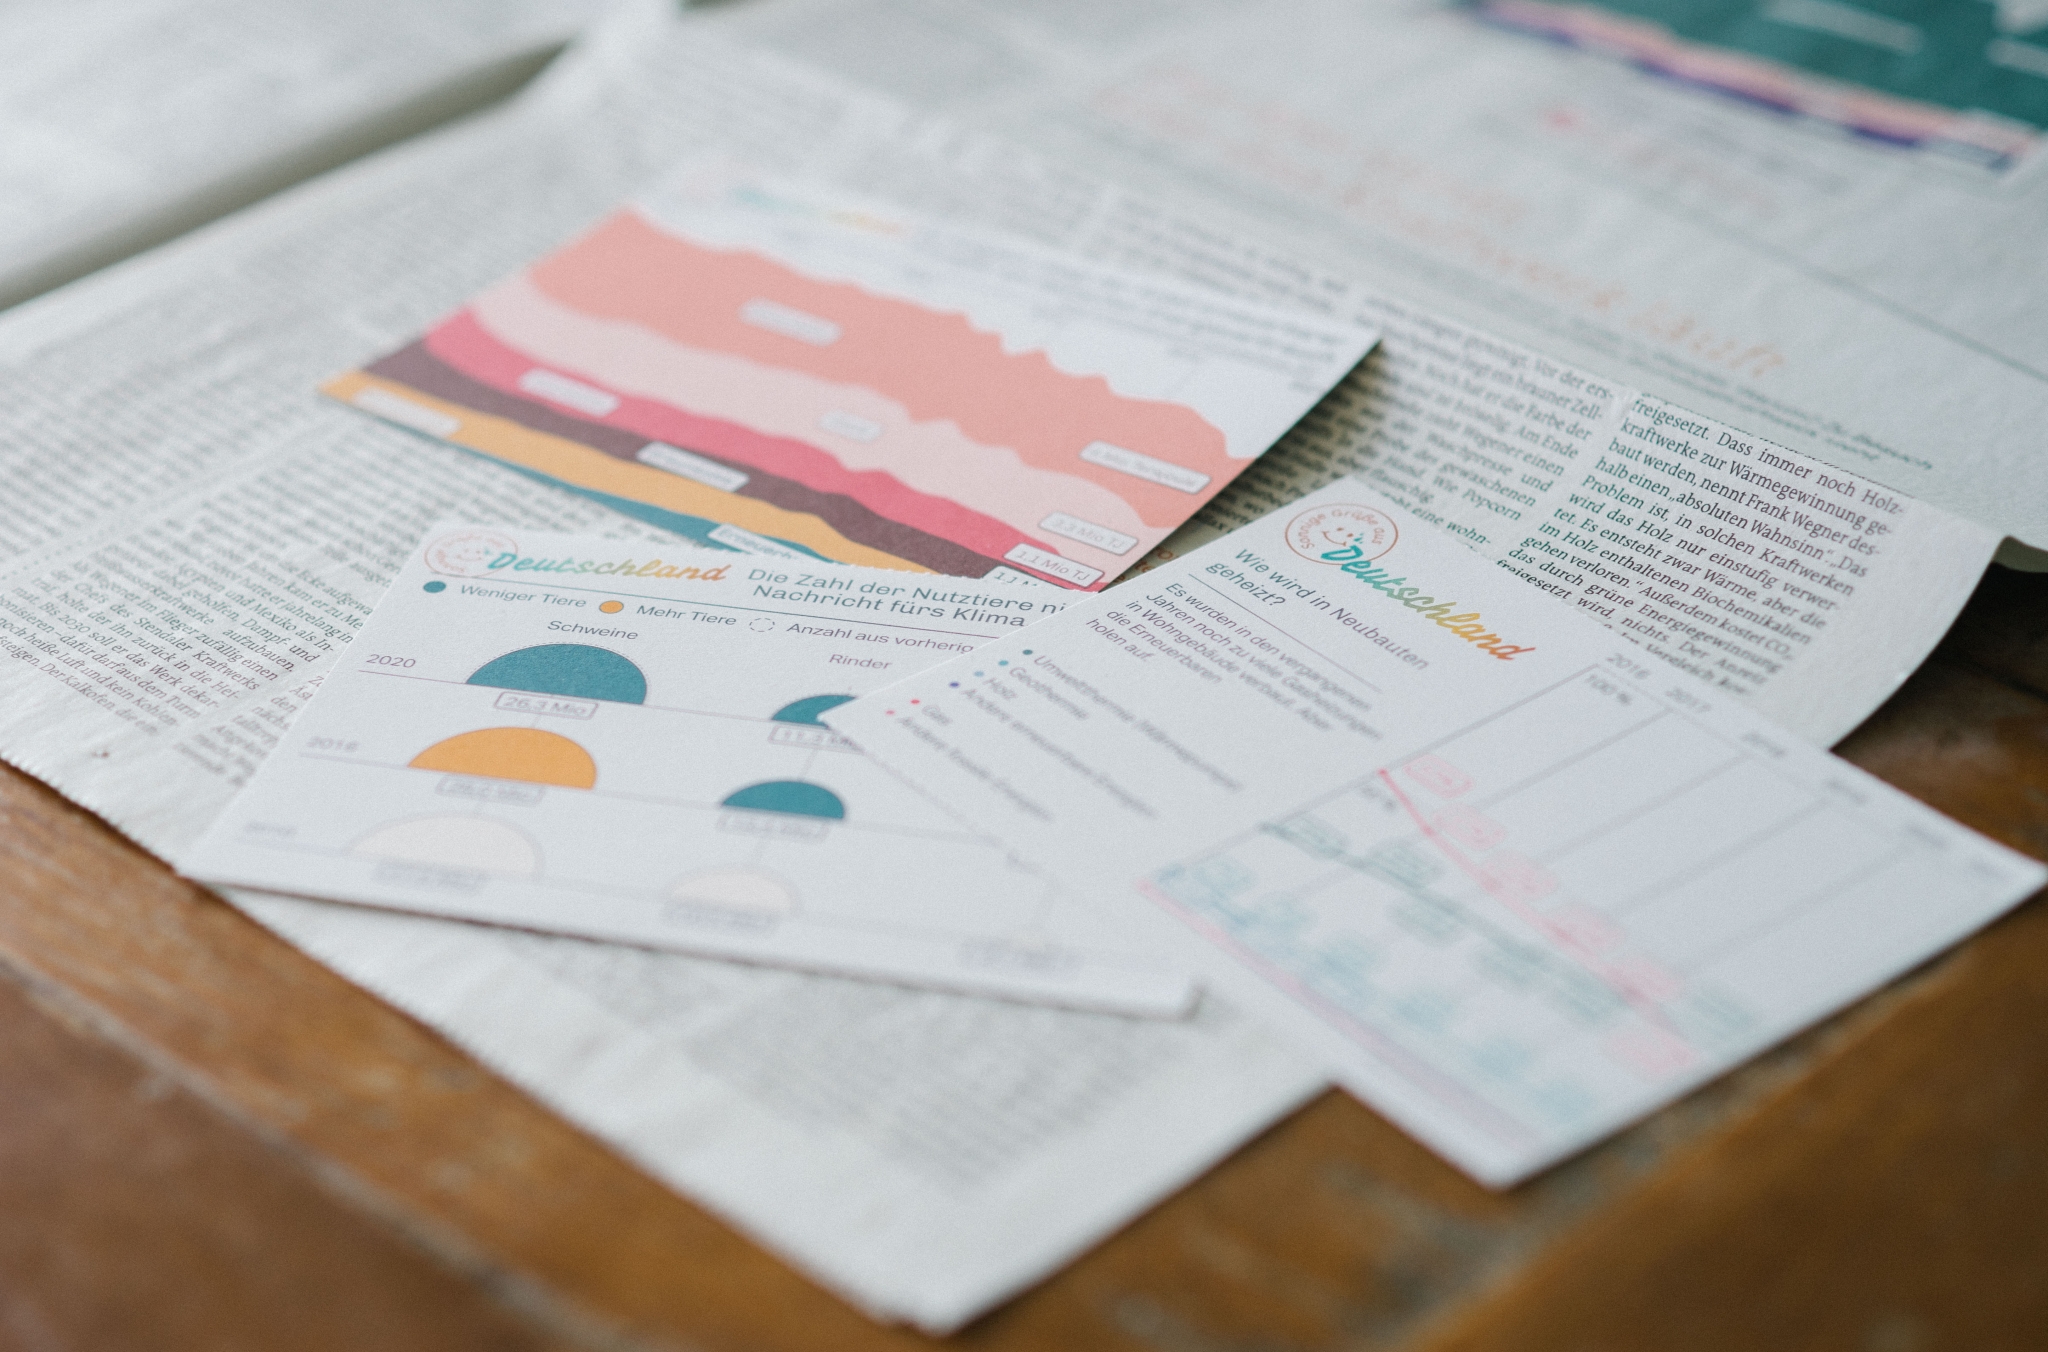
Klimakarten on taz
https://taz.de/taz-Datenprojekt-zum-Klimaschutz/!5898240/
Excerpt from the project website
https://uclab.fh-potsdam.de/projects/klimakarten/
In collaboration with the newspaper taz, we designed and produced both physical and digital postcards containing visualizations covering various aspects of climate protection and mitigation in Germany. For each of the 401 districts and 16 states in Germany, the reader can explore climate protection postcards in the five sectors: energy, mobility, buildings, agriculture, and waste. The goal of our research is to study readers’ engagement with data visualizations on the topic of climate protection — across multiple media channels. A central ambition here is that the communication of climate change should not cause readers to feel anxious, numb, or even enter a state of shock, but develop an interest and engage locally with climate change and its ramifications. ...
The hybrid – both digital and physical – postcards are aimed specifically to readers, with the goal of engaging them in local climate protection. Our intention was to foster exploration and comparison of different regions to show the regional relevance of climate protection. The postcards are spread across various newspaper publication channels.
Publication
Morini, F., Eschenbacher, A., Hartmann, J. and Dörk, M. (2023) From Shock to Shift: Data Visualization for Constructive Climate Journalism. IEEE Transactions on Visualization and Computer Graphics, 30 (1), 413-1423, DOI:10.1109/TVCG.2023.3327185.

